Statistics
The «Statistics» section provides tools for accessing information about provided services in the form of online tables (reports).
To obtain data for a specific report type, navigate to the corresponding section through the main menu of your personal account. Then, select the desired report type and use the available filters at the top of the page.
The selected report will display the types of services and products used within the specified time period.
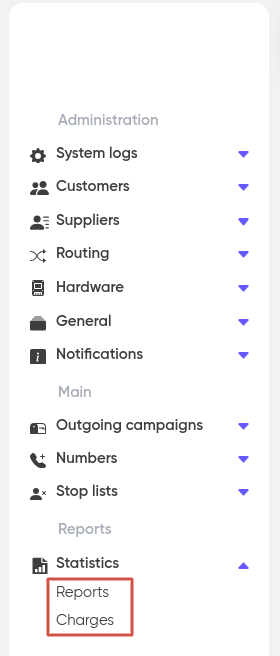
Reports
Reports can be viewed «By apps» and «By services»:

By apps:
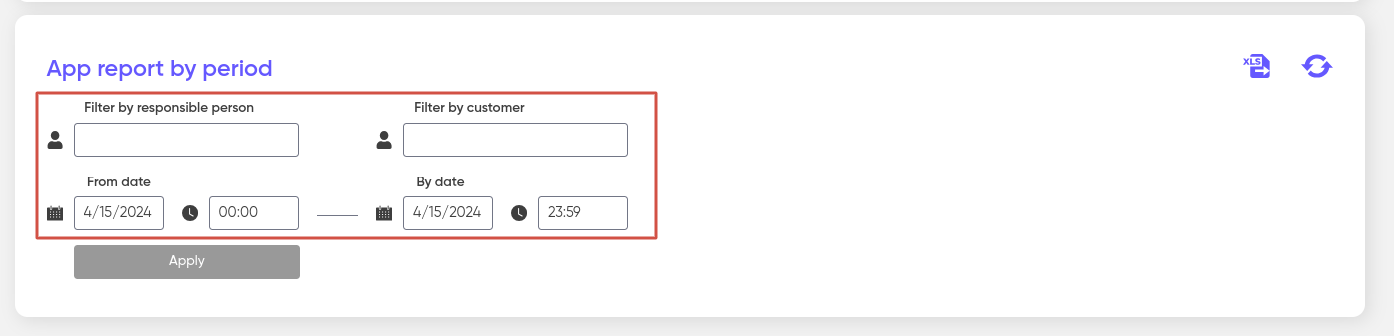
By period
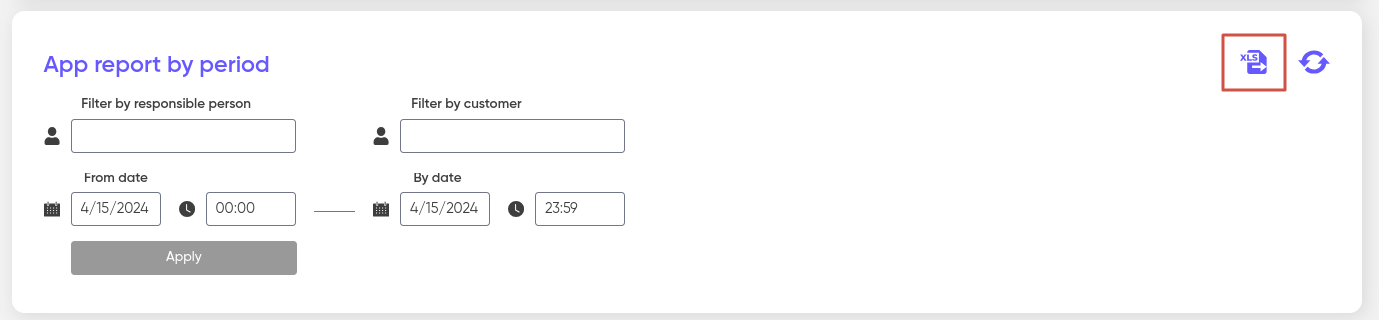
Displays data on the total amount of your expenses for the specified period. To generate the report, you need to set filters for the responsible person and the customer.

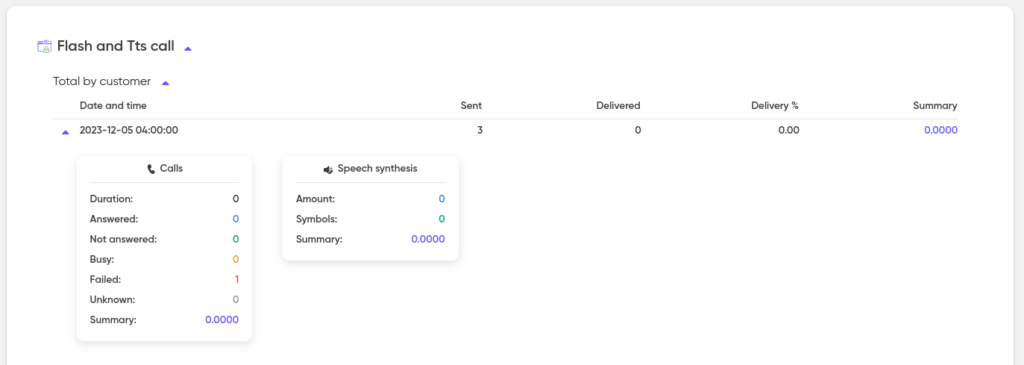
Each application is presented in separate rows, which contain tables with information:
a) calls (number and status of calls);
b) speech synthesis (symbols and quantity);
c) speech recognition (duration and quantity) .
For example, the “Calls” service table will contain information about the total duration of all calls for the specified period, as well as the statuses of completed calls: Answered, Unanswered, Busy, Unsuccessful, Unknown.
You can also export the report in xls format by clicking on the button of the same name:
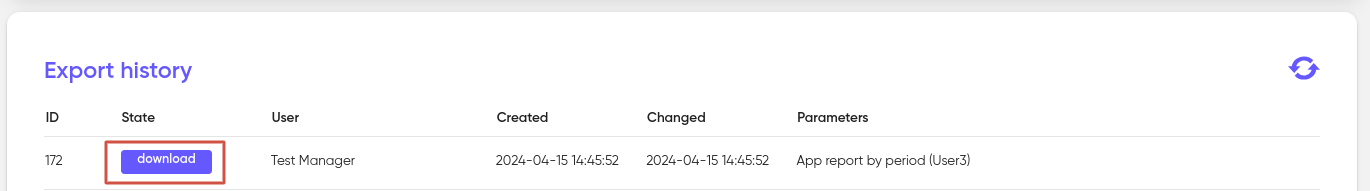
After clicking on the xls button, you will be automatically redirected to the «Export History» page, which contains all the generated files that can be downloaded.
By days
Displays data on the total amount of your expenses for the provided products over the selected number of days, with the option to export data in XLS format. To generate the report, you must also set filters for the responsible person and customer.
The daily report format is similar to the period report, but instead of a single table, multiple tables are generated for each application.
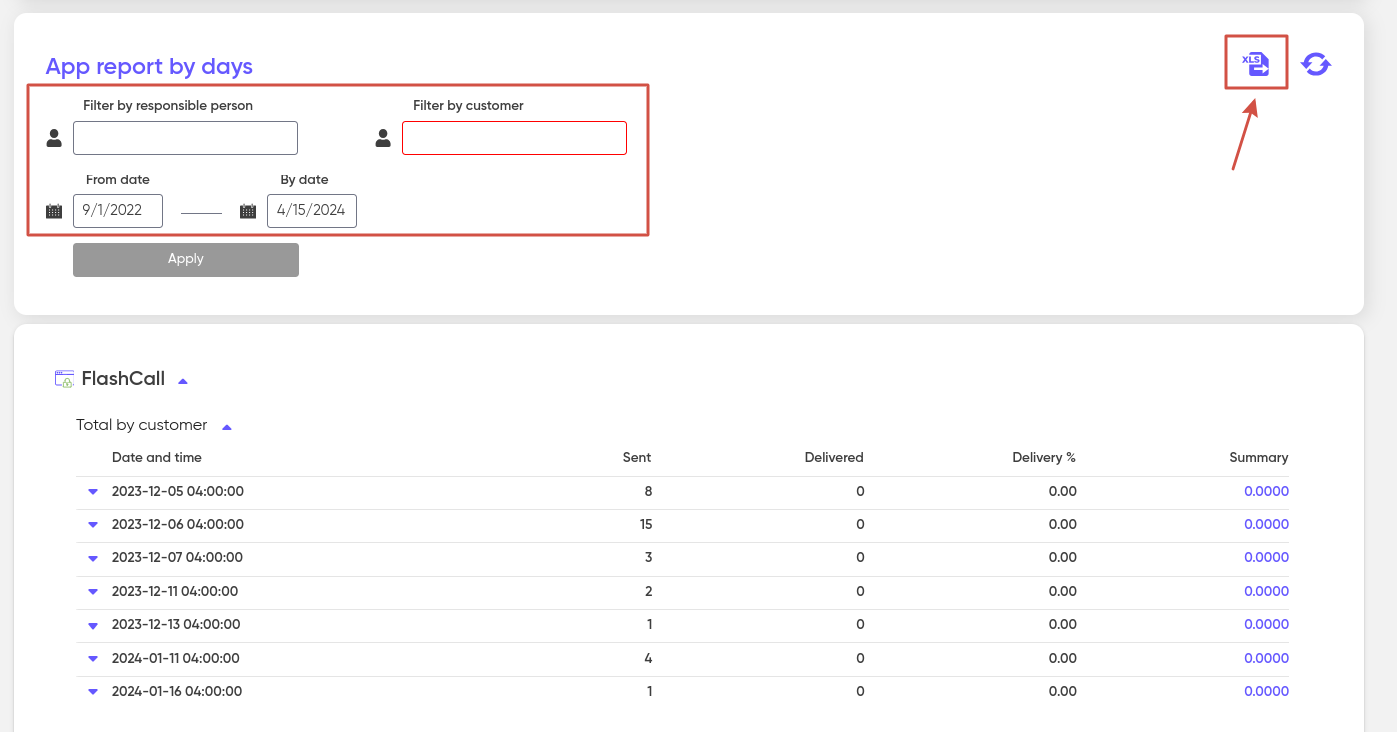
The «Total by customer» table provides aggregated metrics for the application across all connections for each day, including total expenses, volume, and statuses.
For better readability, the data in the daily report tables are displayed as expandable lists.
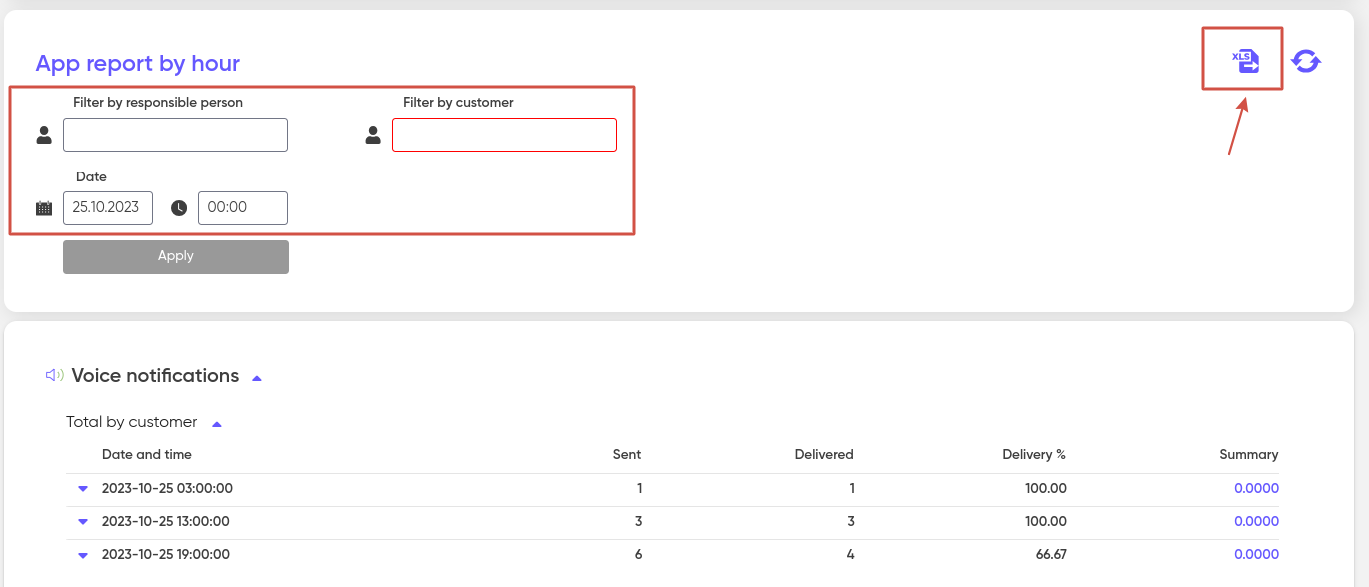
By hours
It looks like a daily report.
Displays hourly data on the responsible person and the customer for the specified date with the ability to export to xls format.
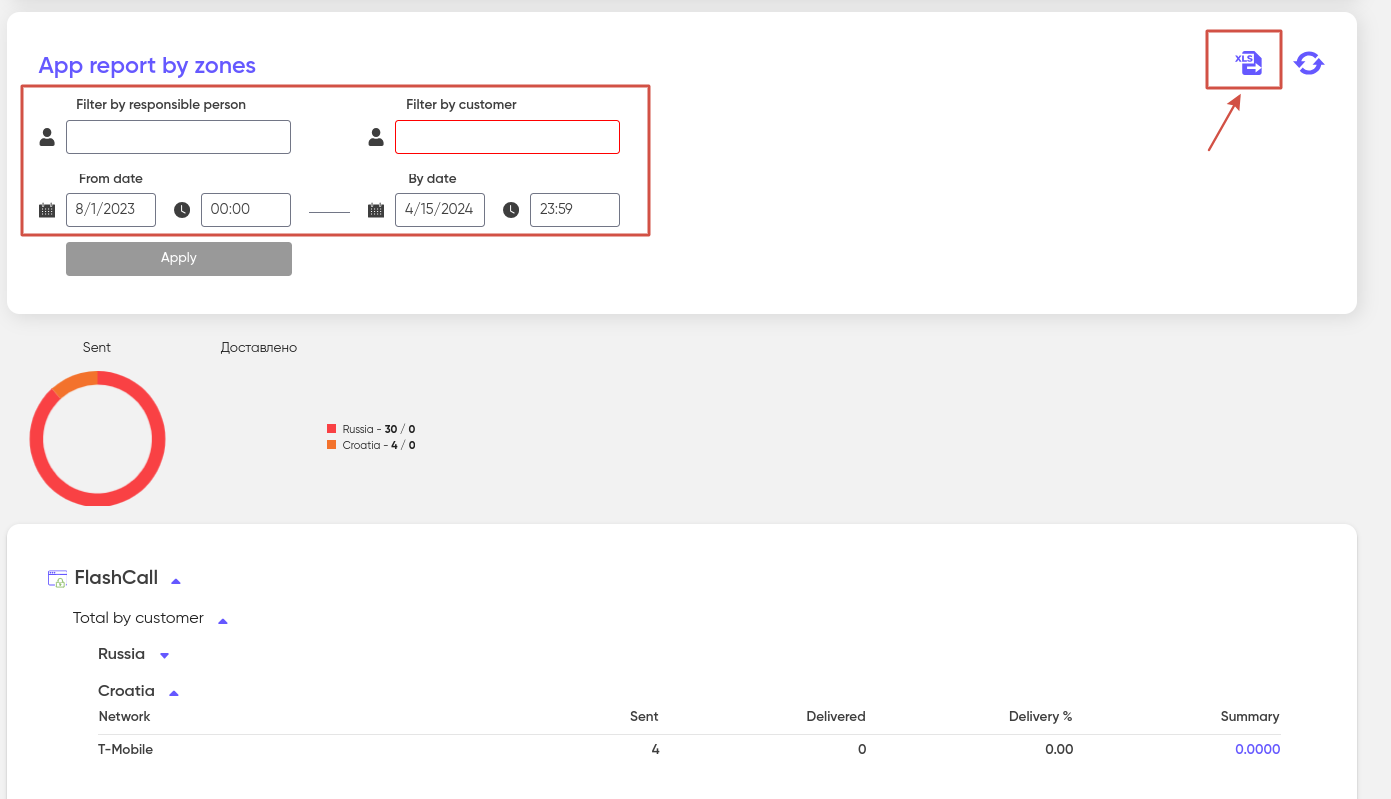
By zones
Similar to the daily and hourly reports, this report provides information broken down by the networks through which calls, requests, or deliveries were made during the selected time interval, with the option to export the data to an XLS file.
To generate the report, you need to set filters for the responsible person and customer.
Each table is complemented with pie charts that display the distribution of each service’s volume across zones and networks.
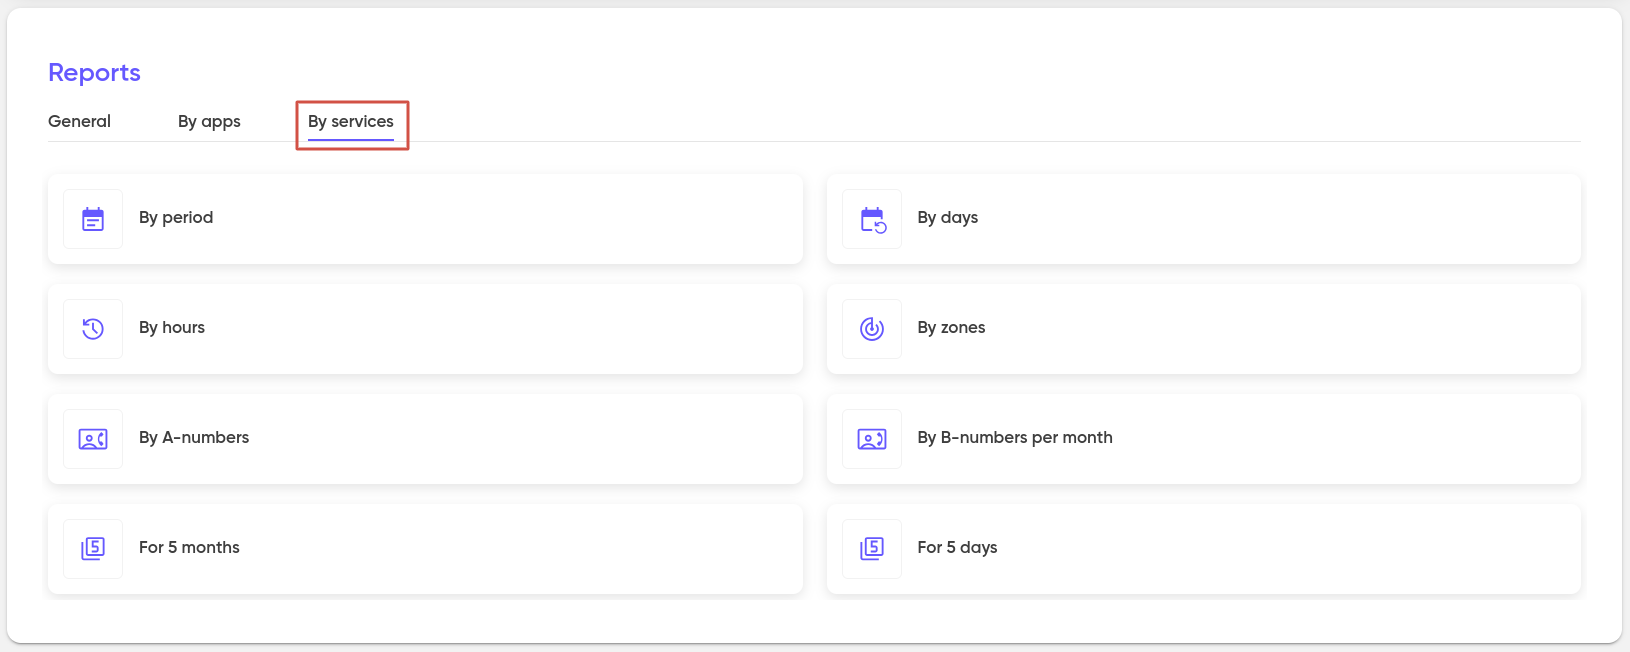
By services:
By period
To generate a report on your financial expenses for a specific time period, you need to select a customer in the filter, and then you can export the report in XLS format.

Each service is represented by a separate table that contains:
a) the amount of expenses (for connections);
b) volume and statuses (by connections);
c) the sum of all indicators in the «Total» line.
For example, the “Calls” service table will contain information about the total duration of all calls for the specified period, as well as the statuses of completed calls: Answered, Unanswered, Busy, Unsuccessful, Unknown.
By days
Displays data on the amount of your expenses for the services provided, for the customer for the selected number of days, and also allows you to export to an xls file.
The type of report for a day resembles a report for a period, with the difference that several tables are displayed for each service.
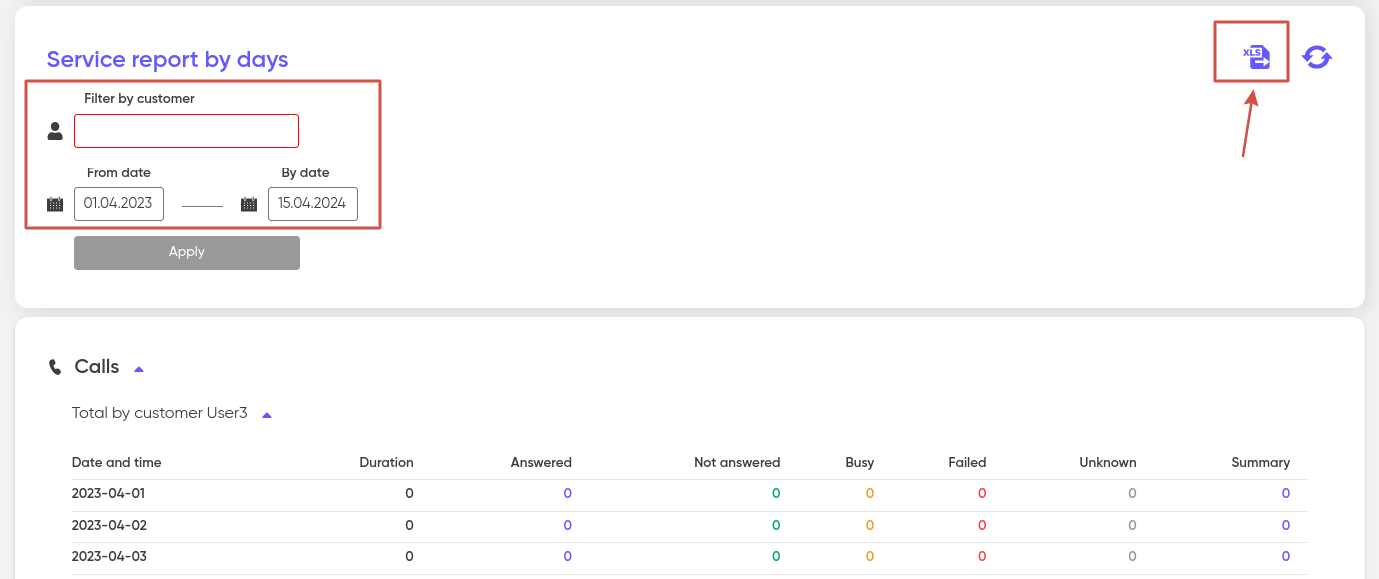
The «Total» table displays information on expenses, volume, and service statuses for each selected day across all connections. Additionally, the table includes a «Total» row that shows the aggregate values for the entire period.
For easier analysis, the daily reports are presented in an expanded format, which can be collapsed or expanded as needed.
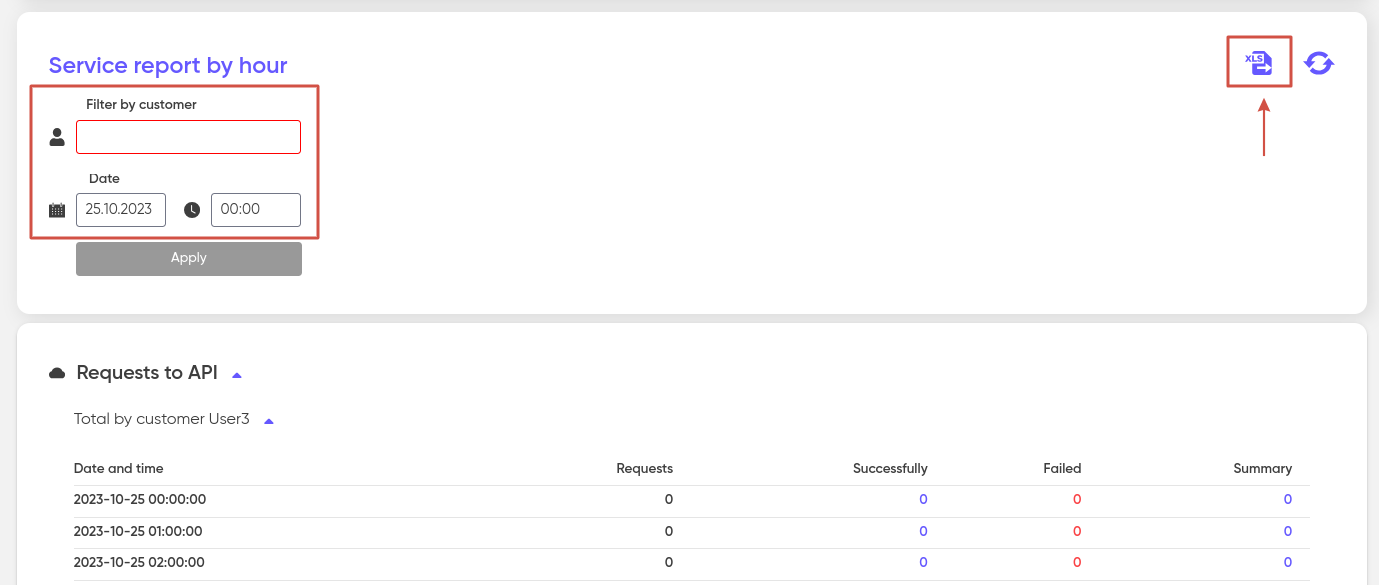
By hours
It looks like a daily report.
Outputs hourly customer data on the specified date with the ability to export to xls format.
By zones
It looks like reports by day and hour.
Similar to the daily and hourly reports, this report provides information on calls/requests/deliveries broken down by networks for a specific customer during the selected time period, with the option to export the data to an XLS file.
Each table is accompanied by pie charts showing the distribution of each service’s volume across zones and networks.

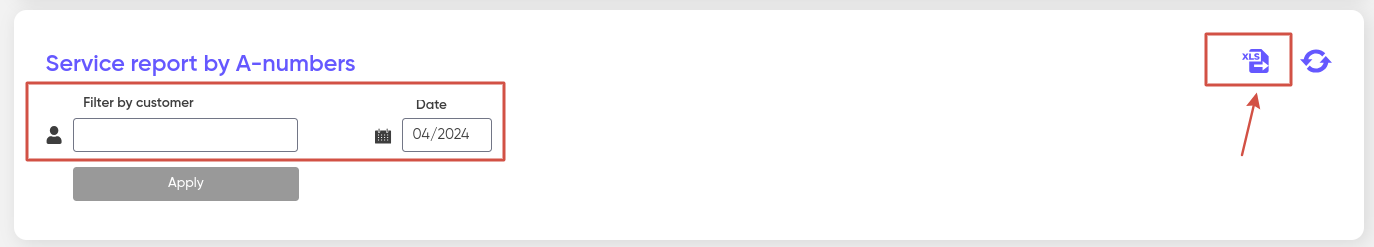
By A-numbers
It is similar to the report for the period.
Displays data in the context of numbers for a specific customer from which calls/requests/deliveries were made for the selected date, which allows you to export the report to an xls file.
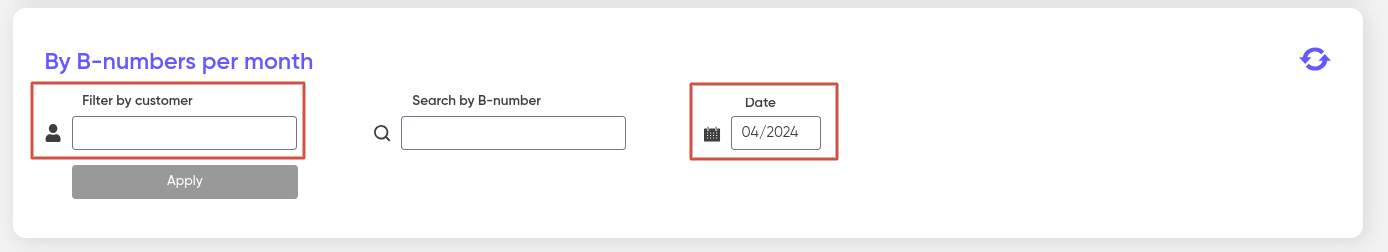
By B-numbers per month
It is similar to the A-numbers report.
Displays data in the context of the numbers of a certain customer to which calls/requests/deliveries were made for a specified period of time in the month and year.
The «Search by B-number» filter allows you to collect data for the report, limited to the selected phone number.
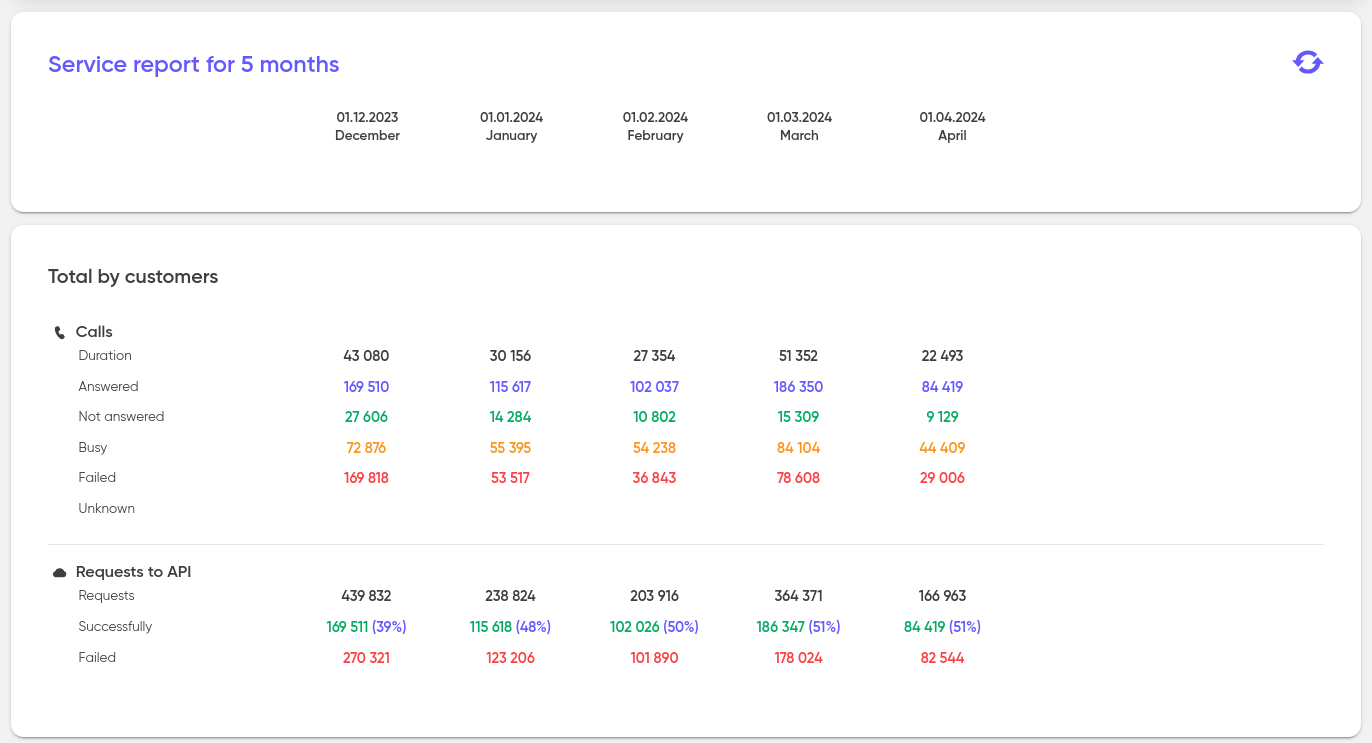
For 5 month
This report displays data from the last 5 months regarding all types of services, applications, and customers utilized during this period.
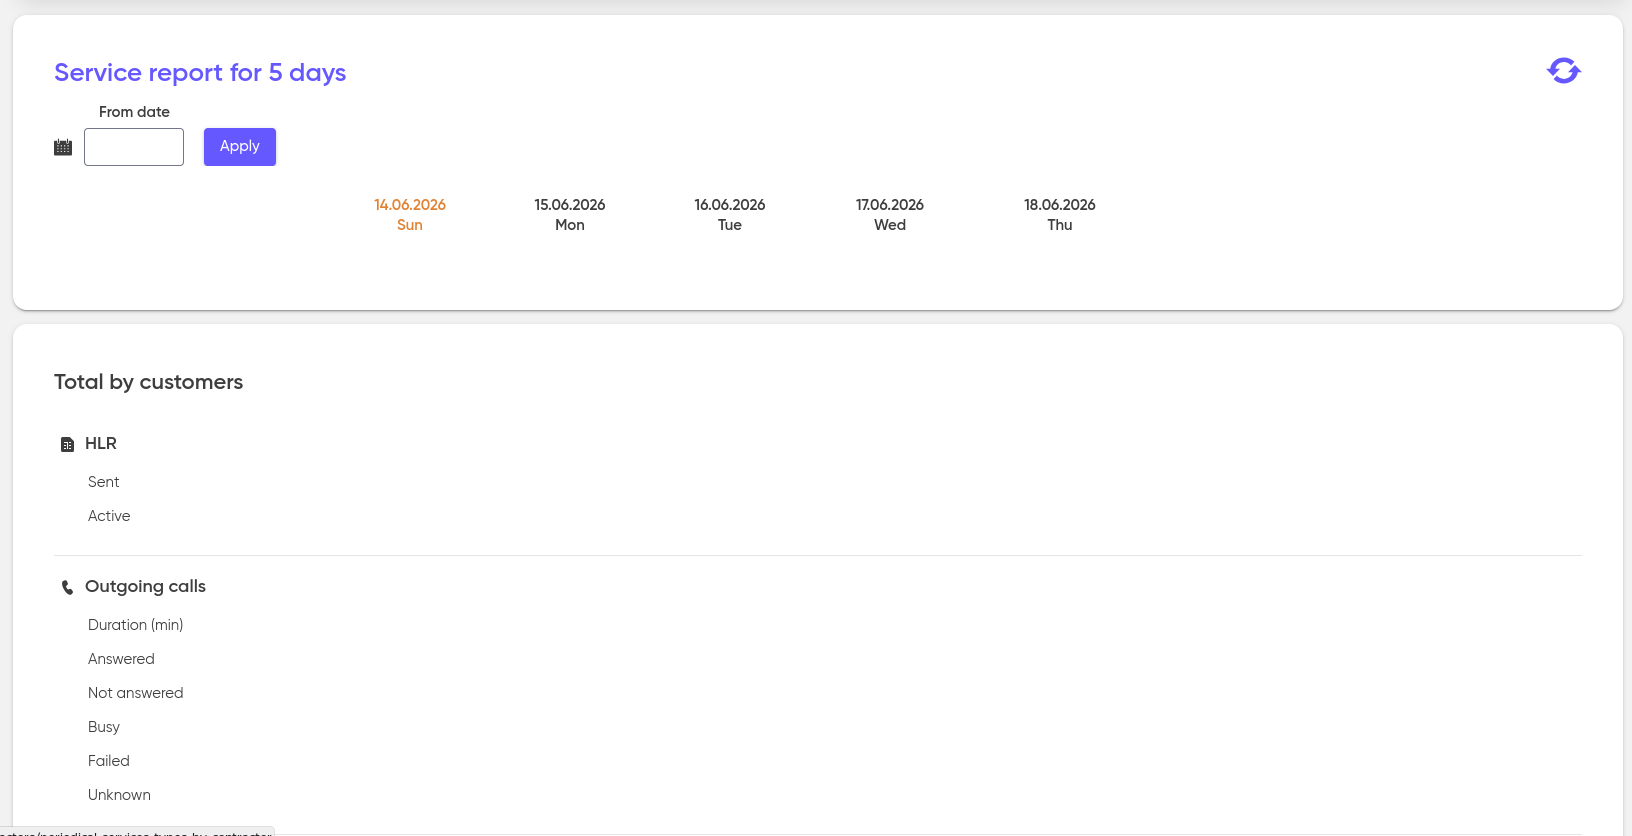
For 5 day
The «5 days» report is similar to the «5 months» report, only it shows the services, applications and customers that have been used in the last five days.
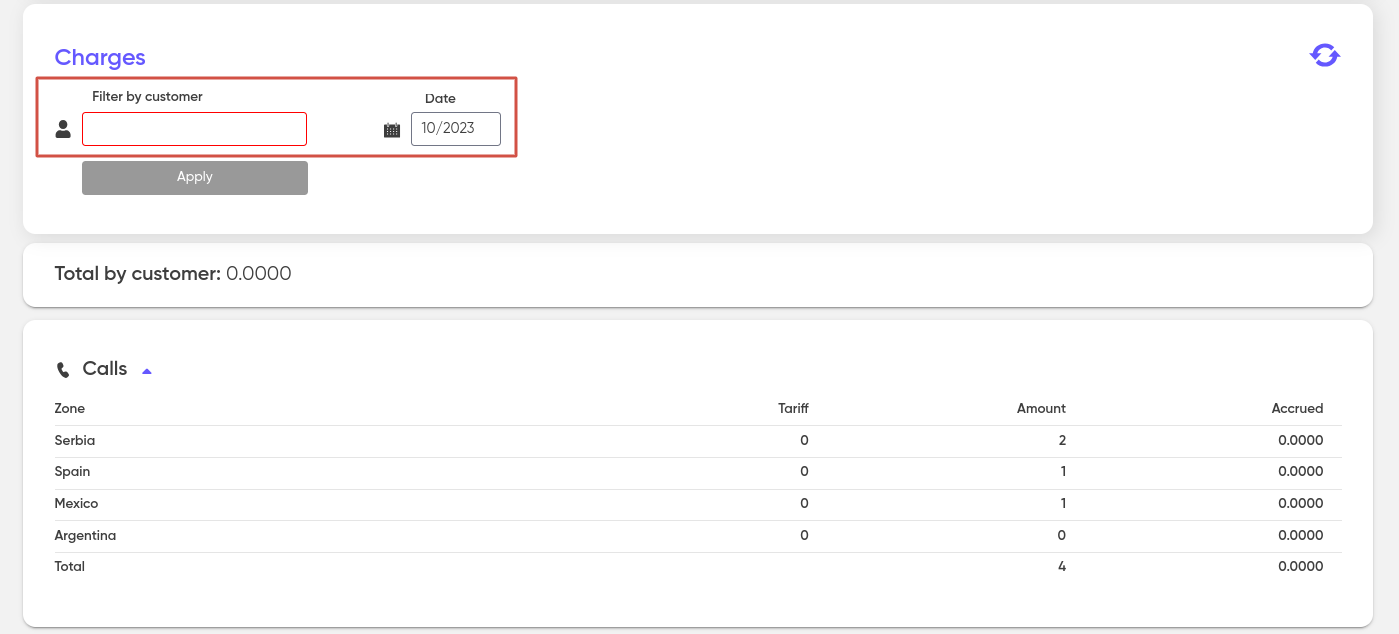
Charges
To get a list of charges for a specific customer, select it and specify the date (month and year) for which you want to view charges for all used tariffs. Then the system will display data on the amount of expenses for a calendar month in the context of Zones/Tariffs/Volumes.